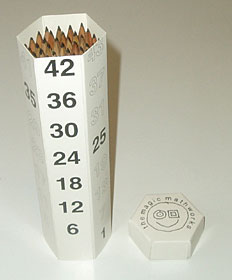
 The prime climb pencil, its box and the chart go up in 6s.
You may wonder what patterns appear when you go up in 3s, 4s, 5s, 7s, 8s, 9s, 10s, …
Share the work out among your friends/fellow maths club members/classmates and make ‘prime climb’ boxes based on the equilateral triangle, square, regular pentagon, … and so on up.
For 3s you could use a Toblerone bar; for 4s, a milk carton, but you’ve still got to put the numbers round so it’s better to start from scratch with white card.
The Numdrum itself provides the 10s so there’s no need to make a decagonal box – unless you want all the boxes to look the same. The boxes will also look the same if you make them all like the Numdrum: cylinders, not prisms. It’s up to you.
Making a chart is a bit harder than making a box, but here are hints for both.
For no special reason we’ve chosen 5s for our example.
A prime climb box going up in 5s
The box doesn’t need a top and bottom. But it needs a tab for sticking the edges which meet.
Put the numbers on before you fold the box.
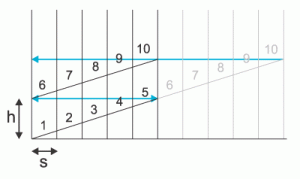
If you undo a paper towel roll or a toilet roll, you find you’ve got a very long parallelogram. Think of this when you make your box:

h needs to be up to 2 x the height of your numbers.
As you can work out, the total height needs to be 100/5 x h = 20h.
s needs to be up to 3/2 x the width of a wide 2-digit number like ’44’.
You can draw the numbers by hand, use transfer lettering, or use the word-processing package on a computer and print the result straight on to the card itself. For a permanent job, laminate the card. You can then use non-permanent felt pens to draw lines (actually 3-D spirals, ‘helices’) connecting multiples of a chosen number.
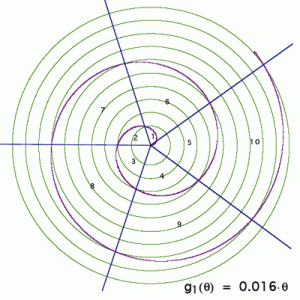
A prime climb chart going up in 5s
The chart is a circle with 5 sectors, each 360°/5 = 72°.
A spiral (of the ‘Archimedean’ type) winds out from the centre.
To make this by hand, you need to draw concentric circles, equally and finely spaced.
By the time your line has moved into a new sector, it has swung out to the next circle:

An easier solution is to use a dynamic geometry package on a computer, e.g. Geometer’s Sketchpad. Choose ‘polar’ grid. For the chart going up in 6s we used the equation f(θ) = 0.0025θ, but for 5s, your spiral must wind even more tightly. Try f(θ) = 0.0020θ. As you see in our diagram, you can draw the radial lines and print the figures as well.
Use the ‘Contact us’ link on our website and attach a file with your findings – and even photographs of what you’ve made. We may be able to have them published in the Mathematical Association’s magazine Symmetry+.


